Since the middle of the XX century. in various fields of human activity, mathematical methods and computers began to be widely used. New disciplines such as "mathematical economics", "mathematical chemistry", "mathematical linguistics", etc., have emerged that study mathematical models of relevant objects and phenomena, as well as methods for studying these models.
A mathematical model is an approximate description of any class of phenomena or objects of the real world in the language of mathematics. The main purpose of modeling is to explore these objects and predict the results of future observations. However, modeling is also a method of cognition of the surrounding world, which makes it possible to control it.
Mathematical modeling and the associated computer experiment are indispensable in cases where a full-scale experiment is impossible or difficult for one reason or another. For example, it is impossible to set up a full-scale experiment in history to check “what would happen if...” It is impossible to check the correctness of this or that cosmological theory. In principle, it is possible, but hardly reasonable, to experiment with the spread of some disease, such as the plague, or to carry out a nuclear explosion in order to study its consequences. However, all this can be done on a computer, having previously built mathematical models of the phenomena under study.
1) Model building. At this stage, some "non-mathematical" object is specified - a natural phenomenon, construction, economic plan, production process, etc. In this case, as a rule, a clear description of the situation is difficult. First, the main features of the phenomenon and the relationship between them at a qualitative level are identified. Then the found qualitative dependencies are formulated in the language of mathematics, that is, a mathematical model is built. This is the most difficult part of the modeling.
2) Solving the mathematical problem that the model leads to. At this stage, much attention is paid to the development of algorithms and numerical methods for solving the problem on a computer, with the help of which the result can be found with the required accuracy and within the allowable time.
3) Interpretation of the obtained consequences from the mathematical model. The consequences derived from the model in the language of mathematics are interpreted in the language accepted in this field.
4) Checking the adequacy of the model. At this stage, it is found out whether the results of the experiment agree with the theoretical consequences from the model within a certain accuracy.
5) Model modification. At this stage, either the model becomes more complex so that it is more adequate to reality, or it is simplified in order to achieve a practically acceptable solution.
Models can be classified according to different criteria. For example, according to the nature of the problems being solved, models can be divided into functional and structural ones. In the first case, all quantities characterizing a phenomenon or object are expressed quantitatively. At the same time, some of them are considered as independent variables, while others are considered as functions of these quantities. A mathematical model is usually a system of equations of various types (differential, algebraic, etc.) that establish quantitative relationships between the quantities under consideration. In the second case, the model characterizes the structure of a complex object, consisting of separate parts, between which there are certain connections. Typically, these relationships are not quantifiable. To build such models, it is convenient to use graph theory. A graph is a mathematical object, which is a set of points (vertices) on a plane or in space, some of which are connected by lines (edges).
By the nature of the initial data and prediction results, models can be divided into deterministic and probabilistic-statistical. Models of the first type give definite, unambiguous predictions. Models of the second type are based on statistical information, and the predictions obtained with their help are of a probabilistic nature.
1) Problems about the movement of the projectile.
Consider the following problem in mechanics.
The projectile is launched from the Earth with an initial velocity v 0 = 30 m/s at an angle a = 45° to its surface; it is required to find the trajectory of its movement and the distance S between the start and end points of this trajectory.
Then, as it is known from the school physics course, the motion of the projectile is described by the formulas:
where t - time, g = 10 m / s 2 - free fall acceleration. These formulas give the mathematical model of the task. Expressing t in terms of x from the first equation and substituting it into the second, we get the equation for the trajectory of the projectile:
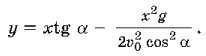
This curve (parabola) intersects the x-axis at two points: x 1 \u003d 0 (the beginning of the trajectory) and 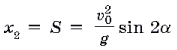 (the place where the projectile fell). Substituting the given values v0 and a into the obtained formulas, we obtain
answer: y \u003d x - 90x 2, S \u003d 90 m.
Note that a number of assumptions were used in the construction of this model: for example, it is assumed that the Earth is flat, and the air and rotation of the Earth do not affect the movement of the projectile.
2) The problem of a tank with the smallest surface area.
It is required to find the height h 0 and radius r 0 of a tin tank with a volume V = 30 m 3, having the shape of a closed circular cylinder, at which its surface area S is minimal (in this case, the smallest amount of tin will be used to manufacture it).
We write the following formulas for the volume and surface area of a cylinder of height h and radius r:
V = p r 2 h, S = 2p r(r + h).
Expressing h in terms of r and V from the first formula and substituting the resulting expression into the second, we get:
![]()
Thus, from a mathematical point of view, the problem is reduced to determining the value of r at which the function S(r) reaches its minimum. Let us find those values of r 0 for which the derivative
![]()
goes to zero:  You can check that the second derivative of the function S(r) changes sign from minus to plus when the argument r passes through the point r 0 . Therefore, the function S(r) has a minimum at the point r0. The corresponding value h 0 = 2r 0 . Substituting the given value V into the expression for r 0 and h 0, we obtain the desired radius
 ![]() and height
and height ![]()
3) Transport task.
There are two flour warehouses and two bakeries in the city. Every day, 50 tons of flour are exported from the first warehouse, and 70 tons from the second to the factories, with 40 tons to the first and 80 tons to the second.
Denote by a ij is the cost of transporting 1 ton of flour from the i-th warehouse to the j-th plant (i, j = 1.2). Let be
a 11 \u003d 1.2 p., a 12 \u003d 1.6 p., a 21 \u003d 0.8 p., a 22 = 1 p.
How should transportation be planned so that their cost is minimal?
Let's give the problem a mathematical formulation. Let us denote by x 1 and x 2 the amount of flour to be transported from the first warehouse to the first and second factories, and by x 3 and x 4 - from the second warehouse to the first and second factories, respectively. Then:
x 1 + x 2 = 50, x 3 + x 4 = 70, x 1 + x 3 = 40, x 2 + x 4 = 80. (1)
The total cost of all transportation is determined by the formula
f = 1.2x1 + 1.6x2 + 0.8x3 + x4.
From a mathematical point of view, the task is to find four numbers x 1 , x 2 , x 3 and x 4 that satisfy all given conditions and give the minimum of the function f. Let us solve the system of equations (1) with respect to xi (i = 1, 2, 3, 4) by the method of elimination of unknowns. We get that
x 1 \u003d x 4 - 30, x 2 \u003d 80 - x 4, x 3 \u003d 70 - x 4, (2)
and x 4 cannot be uniquely determined. Since x i i 0 (i = 1, 2, 3, 4), it follows from equations (2) that 30J x 4 J 70. Substituting the expression for x 1 , x 2 , x 3 into the formula for f, we obtain
f \u003d 148 - 0.2x 4.
It is easy to see that the minimum of this function is achieved at the maximum possible value of x 4, that is, at x 4 = 70. The corresponding values of other unknowns are determined by formulas (2): x 1 = 40, x 2 = 10, x 3 = 0.
4) The problem of radioactive decay.
Let N(0) be the initial number of atoms of the radioactive substance, and N(t) be the number of undecayed atoms at time t. It has been experimentally established that the rate of change in the number of these atoms N "(t) is proportional to N (t), that is, N" (t) \u003d –l N (t), l > 0 is the radioactivity constant of a given substance. In the school course of mathematical analysis, it is shown that the solution to this differential equation has the form N(t) = N(0)e –l t . The time T, during which the number of initial atoms has halved, is called the half-life, and is an important characteristic of the radioactivity of a substance. To determine T, it is necessary to put in the formula ![]() Then
Then ![]() For example, for radon l = 2.084 10–6, and hence T = 3.15 days.
For example, for radon l = 2.084 10–6, and hence T = 3.15 days.
5) The traveling salesman problem.
A traveling salesman living in city A 1 needs to visit cities A 2 , A 3 and A 4 , each city exactly once, and then return back to A 1 . It is known that all cities are connected in pairs by roads, and the lengths of roads b ij between cities A i and A j (i, j = 1, 2, 3, 4) are as follows:
b 12 = 30, b 14 = 20, b 23 = 50, b 24 = 40, b 13 = 70, b 34 = 60.
 It is necessary to determine the order of visiting cities, in which the length of the corresponding path is minimal.
Let's depict each city as a point on the plane and mark it with the corresponding label Ai (i = 1, 2, 3, 4). Let's connect these points with line segments: they will depict roads between cities. For each “road”, we indicate its length in kilometers (Fig. 2). The result is a graph - a mathematical object consisting of a certain set of points on the plane (called vertices) and a certain set of lines connecting these points (called edges). Moreover, this graph is labeled, since some labels are assigned to its vertices and edges - numbers (edges) or symbols (vertices). A cycle on a graph is a sequence of vertices V 1 , V 2 , ..., V k , V 1 such that the vertices V 1 , ..., V k are different, and any pair of vertices V i , V i+1 (i = 1, ..., k – 1) and the pair V 1 , V k are connected by an edge. Thus, the problem under consideration is to find such a cycle on the graph passing through all four vertices for which the sum of all edge weights is minimal. Let's search through all the different cycles passing through four vertices and starting at A 1:
1) A 1, A 4, A 3, A 2, A 1;
2) A 1, A 3, A 2, A 4, A 1;
3) A 1 , A 3 , A 4 , A 2 , A 1 .
Now let's find the lengths of these cycles (in km): L 1 = 160, L 2 = 180, L 3 = 200. So, the route of the smallest length is the first one.
Note that if there are n vertices in a graph and all vertices are connected in pairs by edges (such a graph is called complete), then the number of cycles passing through all vertices is equal. Therefore, in our case there are exactly three cycles.
6) The problem of finding a connection between the structure and properties of substances.
 Consider several chemical compounds called normal alkanes. They consist of n carbon atoms and n + 2 hydrogen atoms (n = 1, 2 ...), interconnected as shown in Figure 3 for n = 3. Let the experimental values of the boiling points of these compounds be known:
y e (3) = - 42°, y e (4) = 0°, y e (5) = 28°, y e (6) = 69°.
It is required to find an approximate relationship between the boiling point and the number n for these compounds. We assume that this dependence has the form
y » a n+b
where a, b - constants to be determined. For finding a and b we substitute into this formula successively n = 3, 4, 5, 6 and the corresponding values of the boiling points. We have:
– 42 » 3 a+ b, 0 » 4 a+ b, 28 » 5 a+ b, 69 » 6 a+b.
To determine the best a and b there are many different methods. Let's use the simplest of them. We express b in terms of a from these equations:
b" - 42 - 3 a, b » – 4 a, b » 28 – 5 a, b » 69 – 6 a.
Let us take as the desired b the arithmetic mean of these values, that is, we put b » 16 - 4.5 a. Let us substitute this value b into the original system of equations and, calculating a, we get for a the following values: a» 37, a» 28, a» 28, a» 36 a the average value of these numbers, that is, we put a» 34. So, the desired equation has the form
y » 34n – 139.
Let's check the accuracy of the model on the initial four compounds, for which we calculate the boiling points using the obtained formula:
y r (3) = – 37°, y r (4) = – 3°, y r (5) = 31°, y r (6) = 65°.
Thus, the calculation error of this property for these compounds does not exceed 5°. We use the resulting equation to calculate the boiling point of a compound with n = 7, which is not included in the initial set, for which we substitute n = 7 into this equation: y р (7) = 99°. The result turned out to be quite accurate: it is known that the experimental value of the boiling point y e (7) = 98°.
7) The problem of determining the reliability of the electrical circuit.
Here we consider an example of a probabilistic model. First, let's give some information from the theory of probability - a mathematical discipline that studies the patterns of random phenomena observed during repeated repetition of an experiment. Let's call a random event A a possible outcome of some experience. Events A 1 , ..., A k form a complete group if one of them necessarily occurs as a result of the experiment. Events are called incompatible if they cannot occur simultaneously in the same experience. Let the event A occur m times during the n-fold repetition of the experiment. The frequency of the event A is the number W = . Obviously, the value of W cannot be predicted exactly until a series of n experiments has been carried out. However, the nature of random events is such that in practice the following effect is sometimes observed: with an increase in the number of experiments, the value practically ceases to be random and stabilizes around some non-random number P(A), called the probability of the event A. For an impossible event (which never occurs in the experiment) P(A)=0, and for a certain event (which always occurs in the experiment) P(A)=1. If events A 1 , ..., A k form a complete group of incompatible events, then P(A 1)+...+P(A k)=1.
Let, for example, the experience consists in throwing a dice and observing the number of dropped points X. Then we can introduce the following random events A i =(X = i), i = 1, ..., 6. They form a complete group of incompatible equally probable events, therefore P(A i) = (i = 1, ..., 6).
The sum of events A and B is the event A + B, which consists in the fact that at least one of them occurs in the experiment. The product of events A and B is the event AB, which consists in the simultaneous occurrence of these events. For independent events A and B, the formulas are true
P(AB) = P(A) P(B), P(A + B) = P(A) + P(B).
8) Consider now the following task. Suppose that three elements are connected in series in an electric circuit, working independently of each other. The failure probabilities of the 1st, 2nd and 3rd elements are respectively P 1 = 0.1, P 2 = 0.15, P 3 = 0.2. We will consider the circuit reliable if the probability that there will be no current in the circuit is not more than 0.4. It is required to determine whether the given chain is reliable.
Since the elements are connected in series, there will be no current in the circuit (event A) if at least one of the elements fails. Let A i be the event that the i-th element works (i = 1, 2, 3). Then P(A1) = 0.9, P(A2) = 0.85, P(A3) = 0.8. Obviously, A 1 A 2 A 3 is the event that all three elements work simultaneously, and
P(A 1 A 2 A 3) = P(A 1) P(A 2) P(A 3) = 0.612.
Then P(A) + P(A 1 A 2 A 3) = 1, so P(A) = 0.388< 0,4. Следовательно, цепь является надежной.
In conclusion, we note that the above examples of mathematical models (among which there are functional and structural, deterministic and probabilistic) are illustrative and, obviously, do not exhaust the whole variety of mathematical models that arise in the natural and human sciences.
In the article brought to your attention, we offer examples of mathematical models. In addition, we will pay attention to the stages of creating models and analyze some of the problems associated with mathematical modeling.
Another issue of ours is mathematical models in economics, examples whose definition we will consider a little later. We propose to start our conversation with the very concept of “model”, briefly consider their classification and move on to our main questions.
We often hear the word "model". What is it? This term has many definitions, here are just three of them:
Based on everything that was said earlier, we can draw a small conclusion: the model allows you to study in detail a complex system or object.
All models can be classified according to a number of criteria:
Information models, in turn, are divided into sign and verbal. And iconic - on computer and non-computer. Now let's move on to a detailed consideration of examples of a mathematical model.
As you might guess, a mathematical model reflects some features of an object or phenomenon using special mathematical symbols. Mathematics is needed in order to model the laws of the world in its own specific language.
The method of mathematical modeling originated quite a long time ago, thousands of years ago, along with the advent of this science. However, the impetus for the development of this modeling method was given by the appearance of computers (electronic computers).
Now let's move on to classification. It can also be carried out according to some signs. They are presented in the table below.
We propose to stop and take a closer look at the last classification, since it reflects the general patterns of modeling and the goals of the models being created.
In this chapter, we propose to dwell in more detail on descriptive mathematical models. In order to make everything very clear, an example will be given.
To begin with, this view can be called descriptive. This is due to the fact that we simply make calculations and forecasts, but we cannot influence the outcome of the event in any way.

A striking example of a descriptive mathematical model is the calculation of the flight path, speed, distance from the Earth of a comet that invaded the expanses of our solar system. This model is descriptive, since all the results obtained can only warn us of some kind of danger. Unfortunately, we cannot influence the outcome of the event. However, based on the calculations obtained, it is possible to take any measures to preserve life on Earth.
Now we will talk a little about economic and mathematical models, examples of which can be various situations. In this case, we are talking about models that help to find the right answer in certain conditions. They must have some parameters. To make it very clear, consider an example from the agrarian part.
We have a granary, but the grain spoils very quickly. In this case, we need to choose the right temperature regime and optimize the storage process.
Thus, we can define the concept of "optimization model". In a mathematical sense, this is a system of equations (both linear and not), the solution of which helps to find the optimal solution in a particular economic situation. We have considered an example of a mathematical model (optimization), but I would like to add one more thing: this type belongs to the class of extreme problems, they help to describe the functioning of the economic system.
We note one more nuance: models can be of a different nature (see the table below).
Now we invite you to talk a little about the mathematical model of multiobjective optimization. Before that, we gave an example of a mathematical model for optimizing a process according to any one criterion, but what if there are a lot of them?

A striking example of a multicriteria task is the organization of proper, healthy and at the same time economical nutrition of large groups of people. Such tasks are often encountered in the army, school canteens, summer camps, hospitals and so on.
What criteria are given to us in this task?
As you can see, these goals do not coincide at all. This means that when solving a problem, it is necessary to look for the optimal solution, a balance between the two criteria.
Speaking about game models, it is necessary to understand the concept of "game theory". Simply put, these models reflect mathematical models of real conflicts. It is only worth understanding that, unlike a real conflict, a game mathematical model has its own specific rules.

Now I will give a minimum of information from game theory, which will help you understand what a game model is. And so, in the model there are necessarily parties (two or more), which are usually called players.
All models have certain characteristics.
The game model can be paired or multiple. If we have two subjects, then the conflict is paired, if more - multiple. An antagonistic game can also be distinguished, it is also called a zero-sum game. This is a model in which the gain of one of the participants is equal to the loss of the other.
In this section, we will focus on simulation mathematical models. Examples of tasks are:

In this case, we are talking about models that are as close as possible to real processes. By and large, they imitate any manifestation in nature. In the first case, for example, we can model the dynamics of the number of ants in one colony. In this case, you can observe the fate of each individual. In this case, the mathematical description is rarely used, more often there are written conditions:
Thus, are used to describe a large system. Mathematical conclusion is the processing of the received statistical data.
It is very important to know that there are some requirements for this type of model, among which are those given in the table below.
Versatility | This property allows you to use the same model when describing groups of objects of the same type. It is important to note that universal mathematical models are completely independent of the physical nature of the object under study. |
Adequacy | Here it is important to understand that this property allows the most correct reproduction of real processes. In operation problems, this property of mathematical modeling is very important. An example of a model is the process of optimizing the use of a gas system. In this case, calculated and actual indicators are compared, as a result, the correctness of the compiled model is checked. |
Accuracy | This requirement implies the coincidence of the values that we obtain when calculating the mathematical model and the input parameters of our real object |
economy | The requirement of economy for any mathematical model is characterized by implementation costs. If the work with the model is carried out manually, then it is necessary to calculate how much time it will take to solve one problem using this mathematical model. If we are talking about computer-aided design, then indicators of time and computer memory are calculated |
In total, it is customary to distinguish four stages in mathematical modeling.

In this section, we will briefly highlight the issue. Examples of tasks can be:
The economic-mathematical model displays an economic abstraction, which is expressed using mathematical terms and signs.
Examples of a computer mathematical model are:
A computer model is an image of an object or system, presented as:
At the same time, this model reflects the structure and interconnections of the system.
We have already talked about what an economic-mathematical model is. An example of solving the problem will be considered right now. We need to analyze the production program to identify the reserve for increasing profits with a shift in the assortment.
We will not fully consider the problem, but only build an economic and mathematical model. The criterion of our task is profit maximization. Then the function has the form: Л=р1*х1+р2*х2… tending to the maximum. In this model, p is the profit per unit, x is the number of units produced. Further, based on the constructed model, it is necessary to make calculations and summarize.

A task. The fisherman returned with the following catch:
How many fish did he buy at the store?
So, an example of constructing a mathematical model of this problem is as follows. We denote the total number of fish as x. Following the condition, 0.2x is the number of fish living in southern latitudes. Now we combine all the available information and get a mathematical model of the problem: x=0.2x+8. We solve the equation and get the answer to the main question: he bought 10 fish in the store.
To build a mathematical model, you need:
Mathematical modeling, in addition to studying an object, process or system and compiling their mathematical description, also includes:
The mathematical description of the processes and systems under study depends on:
The construction of a mathematical model usually begins with the construction and analysis of the simplest, most rough mathematical model of the object, process or system under consideration. In the future, if necessary, the model is refined, its correspondence to the object is made more complete.
Let's take a simple example. You need to determine the surface area of the desk. Usually, for this, its length and width are measured, and then the resulting numbers are multiplied. Such an elementary procedure actually means the following: the real object (table surface) is replaced by an abstract mathematical model - a rectangle. The dimensions obtained as a result of measuring the length and width of the table surface are attributed to the rectangle, and the area of such a rectangle is approximately taken as the desired area of \u200b\u200bthe table. However, the desk rectangle model is the simplest, most rough model. With a more serious approach to the problem, before using the rectangle model to determine the table area, this model needs to be checked. Checks can be carried out as follows: measure the lengths of the opposite sides of the table, as well as the lengths of its diagonals and compare them with each other. If, with the required degree of accuracy, the lengths of the opposite sides and the lengths of the diagonals are pairwise equal, then the surface of the table can indeed be considered as a rectangle. Otherwise, the rectangle model will have to be rejected and replaced by a general quadrilateral model. With a higher requirement for accuracy, it may be necessary to refine the model even further, for example, to take into account the rounding of the corners of the table.
With the help of this simple example, it was shown that the mathematical model is not uniquely determined by the object under study, the process or system.
OR (to be confirmed tomorrow)
Ways to solve mat. Models:
1, Construction of m. on the basis of the laws of nature (analytical method)
2. Formal way with the help of statistical. Processing and measurement results (statistical approach)
3. Construction of a meter based on a model of elements (complex systems)
1, Analytical - use with sufficient study. General regularity known. models.
2. experiment. In the absence of information
3. Imitation m. - explores the properties of the object sst. Generally.
An example of building a mathematical model.
Mathematical model is a mathematical representation of reality.
Mathematical modeling is the process of constructing and studying mathematical models.
All natural and social sciences that use the mathematical apparatus are, in fact, engaged in mathematical modeling: they replace an object with its mathematical model and then study the latter. The connection of a mathematical model with reality is carried out with the help of a chain of hypotheses, idealizations and simplifications. With the help of mathematical methods, as a rule, an ideal object is described, built at the stage of meaningful modeling.
Why are models needed?
Very often, when studying an object, difficulties arise. The original itself is sometimes unavailable, or its use is not advisable, or the involvement of the original is costly. All these problems can be solved with the help of simulation. The model in a certain sense can replace the object under study.
The simplest examples of models
§ A photograph can be called a model of a person. In order to recognize a person, it is enough to see his photograph.
§ The architect created the layout of the new residential area. He can move a high-rise building from one part to another with a movement of his hand. In reality, this would not be possible.
Model types
Models can be divided into material" And ideal. the above examples are material models. Ideal models often have an iconic shape. In this case, real concepts are replaced by some signs, which can be easily fixed on paper, in computer memory, etc.
Mathematical modeling
Mathematical modeling belongs to the class of sign modeling. At the same time, models can be created from any mathematical objects: numbers, functions, equations, etc.
Building a mathematical model
§ There are several stages of constructing a mathematical model:
1. Understanding the task, highlighting the most important qualities, properties, values and parameters for us.
2. Introduction of notation.
3. Drawing up a system of restrictions that must be satisfied by the entered values.
4. Formulation and recording of the conditions that the desired optimal solution must satisfy.
The modeling process does not end with the compilation of the model, but only begins with it. Having compiled a model, they choose a method for finding the answer, solve the problem. after the answer is found, compare it with reality. And it is possible that the answer does not satisfy, in which case the model is modified or even a completely different model is chosen.
Example of a mathematical model
A task
The production association, which includes two furniture factories, needs to upgrade its machine park. Moreover, the first furniture factory needs to replace three machines, and the second seven. Orders can be placed at two machine tool factories. The first factory can produce no more than 6 machines, and the second factory will accept an order if there are at least three of them. It is required to determine how to place orders.
Four seventh grade.
There are 15 girls and 13 boys in 7A,
in 7B - 12 girls and 12 boys,
in 7B - 9 girls and 18 boys,
in 7G - 20 girls and 10 boys.
If we need to answer the question of how many students are in each of the seventh grades, then we will have to perform the same addition operation 4 times:
in 7A 15 + 13 = 28 students;
in 7B 12 +12 = 24 students;
in 7B 9 + 18 = 27 students;
in 7D 20 + 10 = 30 students.
A. V. Pogorelov, Geometry for grades 7-11, Textbook for educational institutions
Lesson content lesson summary support frame lesson presentation accelerative methods interactive technologies Practice tasks and exercises self-examination workshops, trainings, cases, quests homework discussion questions rhetorical questions from students Illustrations audio, video clips and multimedia photographs, pictures graphics, tables, schemes humor, anecdotes, jokes, comics parables, sayings, crossword puzzles, quotes Add-ons abstracts articles chips for inquisitive cheat sheets textbooks basic and additional glossary of terms other Improving textbooks and lessonscorrecting errors in the textbook updating a fragment in the textbook elements of innovation in the lesson replacing obsolete knowledge with new ones Only for teachers perfect lessons calendar plan for the year methodological recommendations of the discussion program Integrated LessonsThe tasks solved by LP methods are very diverse in content. But their mathematical models are similar and are conditionally combined into three large groups of problems:
Table 3.1
Questions for self-control
1. Statement of the transport problem. describe the construction of a mathematical model.
2. What is a balanced and unbalanced transport problem?
3. What is calculated in the objective function of the transport task?
4. What does each inequality of the system of constraints of the plan problem reflect?
5. What does each inequality of the system of constraints of the mixture problem reflect?
6. What do the variables mean in the plan problem and the mixture problem?


